Console
Overview
The Kdb Console tool window is located in the left bottom corner and hidden by default. You have to click on it to activate the console.
By default, the console is empty, and you have to connect to an instance in the Instances Tree or with active connection .
Another way to create new connection and start new console - just create new connection directly from the console by + sign in the title of the console windows:
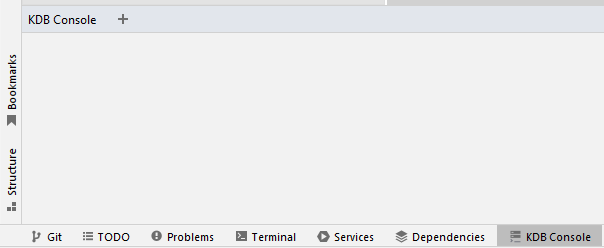
Console Tab
Each connected instance has many tabs in the console of two types:
- Console tab is command line view where you can send commands to the instance and see its results. If Watches Panel is enabled it’s displayed in the right part of the console.

- Table Result and all other tabs - on demand tabs which are shown when you have a table/dict/list as a result or expand any exist table result.
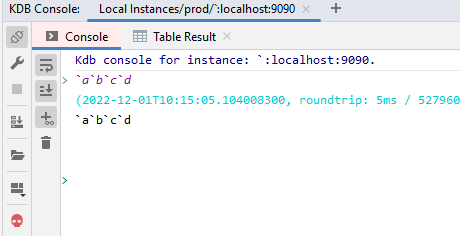
Please check Tables secton to get more details.
Toolboxes
There are many toolboxes in a Console View:
- Console View Toolbox related to the instance itself on the left side where you can:
- Connect/Disconnect the instance
- Quickly change the instance settings, like name or connection parameters
- Stop active query, if possible
- Watches expressions
- Upload any file to the instance
- Open local binary file with KDB data encoded into IPC format
- Change the Console view layout with two options
- and finally, just close the connection and remove the Console View
- Console Toolbox where you can manage output of the commands, like:
- should be text in the console wrapped to new line if it’s too long
- should be new output auto-visible
- is history of all commands should be visible
- and finally ability to clean all history for the console
- Each Table Result has own toolbox with huge functionality. Please check Table View section to get more details about Table Result view.
View Layout
By default, Console table and each Table Result are placed in separate tabs, and you have to switch between them to check a table result and output of the console from the toolbox:
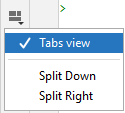
where:
- Tabs view - is default view when each result is located in a separate tab
- Split Down - the console tab will be placed at the top but all Table Result tabs at the bottom:
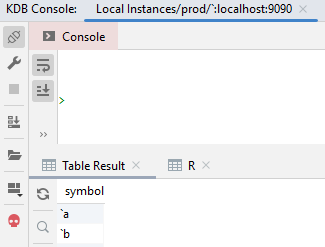
- Split Right - the console tab will be placed on the top but all Table Result tabs on the right:
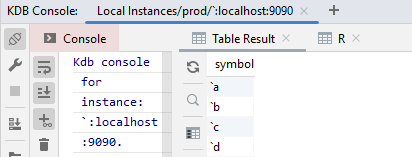
Depends on your working place, one or another layout may be more suitable for you.
You can change default layout for all Console Views in Configuration Options.
Rename/Pin Tab
By default, each instance has only one Table Result tab that is updating each time when new table/dict/vector is received, but you can pin any Table Result by renaming the tab.
Just double-click on a Table Result header or right-click on it to see the context menu:

The tab will be renamed and new Table Result will be opened for new data:
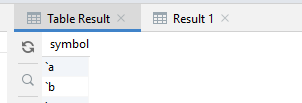
You should remember that each Table Result takes memory depends on how much data you have. If you don’t have memory - probably it’s time to close some tabs.
Floating Results
Although Console tab is always pinned to the Console View, you can drop out and drag in any Table Result tabs to create a separated window:
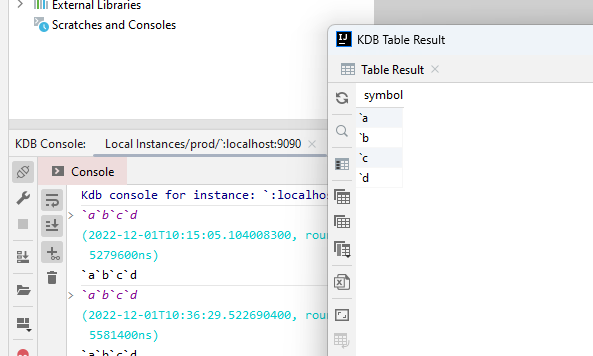
Each floated Table Result has its own context, and expanding table cells will be opened as new tab of the window rather than in the Console View
Uploading File
You can upload any local file to the instance with Upload File functionality:

There are two options for how a file can be uploaded, and that is driven by the option in uploading dialog:
- binary file - uploaded as an array of bytes
- text file - uploaded as an array of strings where each string is in the array is a line in the text file.
The plugin tries to guess a file type, but please make sure that the type is correct before uploading the file.