Inspector
Overview
KDB Inspector scans active instance and loads definition of all global variables, tables and functions and shows it in a tree-like structure.
The Kdb Inspector tool window is located in the right bottom corner and is hidden by default:
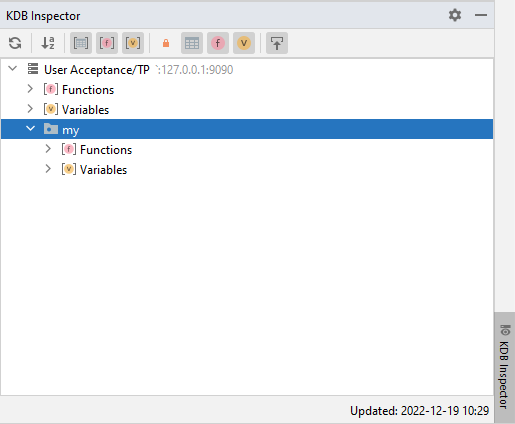
By default, the Inspector doesn’t query an instance, and you have to manually force an update process, but you can enable it for activating instances in configuration.
You can enable/disable grouping and filtering options in the tool window toolbar.
An instance is enquired only one per session, and switching between instances doesn’t generate additional loading on an instance. You can see time of last update in the statusbar of the Inspector.
Permissions
The Inspector executes a free-form query to load all information from an instance. You must allow the query on the server side if free-form queries are prohibited. You can find the latest query on the plugin GitHub page for validation.
Filtering
The Inspector loads definition of all functions, variables and tables, but you can hide any with the appropriate toolbar button:
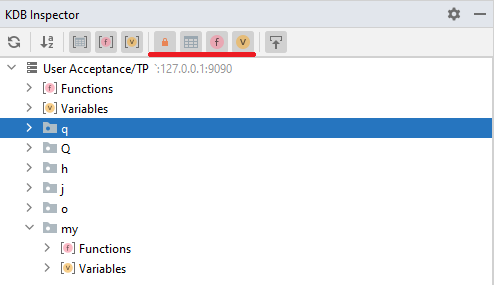
You can also hide/show system namespaces: .q, .Q, .h, .j and .o. Dy default system namespaces are hidden.
The .z is not a namespace but system functions, so it’s not returned by an instance and not shown in the inspector.
Grouping
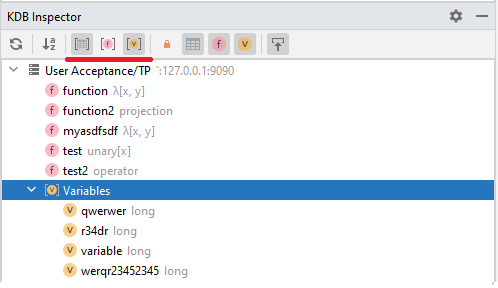
To reduce tree complexity, you can group all elements by returned types:
Search
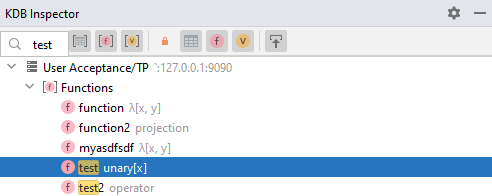
When the Inspector tree is in focus, just start typing a varibale/table or function name to search it in the tree:
Query Value
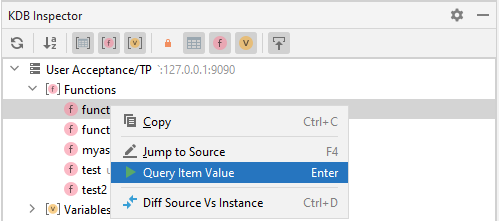
Double-click or Enter on an item will query its value and show the result in Console:
View Source
If Scroll To Source is enabled and item is defined in the project source code, when the item will be highlighted in the main editor.
If an item is defined in the project source code, you can just to its definition by pressing F4 or from pop-up menu.
If an item is a function and is defined in the project source code, you can compare its content defined in the instance with the content of the source code.

Code Difference
When you have a function defined in your source code that is also defined in the instance, you can use ‘Diff’ functionality compare exist source code with actual implementation by Ctrl+D or context menu:

The Diff works only for functions (object type 100) as make no sense for any other types.
New diff tab will be opened in the main editor to show you the difference:

It could be a good idea to ignore white-spaces as KDB can do post-processing and remove some spaces.
Code Completion
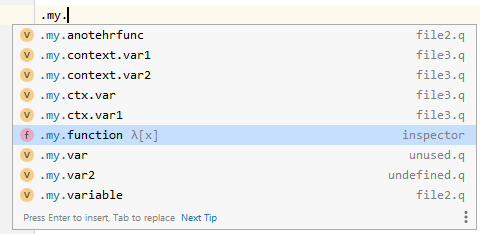
If you have the active Inspector with loaded structure, the content of the inspector is used to get completion variables and the source is indicated as inspector:
